

STIMULUS BILL INCLUDES CLEAN ENERGY INVESTMENTS
A bill that was included within the Covid relief deal authorizes billions in spending over the next five years on solar, wind and other clean power sources. Director of the World Resources Institute calls it,"The most significant piece of climate and energy legislation enacted by Congress in at least a decade." Read More >>>
The science of windy cities
Urbanization over the past few decades has brought developments like drones, planned air taxis, and buildings that keep getting taller. With that, scientists with the American Physical Society's Division of Fluid Dynamics look at one of urban development's most unique contenders: wind. Read more >>
A Warm & wild year for weather
A look back at 2020's extreme weather events and how event attribution science is helping researchers assess their causes. Plus visual representations of our changing weather compared to decades past. Read more >>>

the arctic's official 2020 report card
"For 15 years, the Arctic Report Card has helped NOAA fulfill its mission of providing the scientific information our nation needs to better understand how climate change is affecting the Arctic and weather around the globe,” said retired Navy Rear Adm. Timothy Gallaudet, Ph.D. Read More >>>
Tempest innovator of the month
Keep your outdoor inflatable holiday decorations safe from high winds thanks to our Tempest Innovator of the Month, Brandon Sullivan! Brandon created an IFTTT applet which uses Tempest wind data to turn off inflatable lawn decorations automatically when wind speeds exceed 12 mph. Check out this applet along with others you might find useful on WeatherFlow's IFTTT page! Read more >>>
...with Andy Hudson-Smith, a Professor at University College London, where he teaches an innovative lab course at The Bartlett Centre for Advanced Spatial Analysis. We caught up with him at his now remote laboratory (i.e., his house!) in Norfolk, England.
Q: The Bartlett Center for Spatial Analysis sounds very cool. What is it?
A: The Center for Advanced Spatial Analysis is a research institute that studies the movement of people, objects, places, and spaces; understanding the spatial relationship of data and things in the world around us. It realizes that everything in life has a location.
In the natural world, there is finite space. Spatial analysis is —via the Internet of things and digital space —where you can pin data to an exact location. As soon as you know the location, you can begin to put patterns around it, from the movement of traffic to clouds, to climate. It’s geospatial work, and it’s a geospatial lab. But not a classic geography lab because it’s a mix of computer science architects, psychologists and designers.
Q: We connected because you wrote to us about a new Masters Course you are creating, with the aid of Tempest data. Can you tell us more about that?
A: We are writing a new Masters Course (MSc in Connected Environments). The focus is the Internet of things (IoT), but it’s also creative and arts-based. Everything involves data feeds, which is where climate and weather come in. We require good hyperlocal data feeds, and are currently using the Tempest WeatherFlow Weather Station because it is the first consumer weather station on the market that kind of just works. It’s simple to get the data from it. Our end goal is helping individuals manage and understand climate change in their life.
Q: So how exactly will you use the hyperlocal Tempest data in class?
A: Once you have local climate information and a record of current and past conditions, you can put multiple systems in place that show how much warmer it is than 50 years ago. When you combine these records, there is life beyond the screen. I’m trying to use Tempest data plus other data sets to create a tangible thing.
Q: So the tangible thing is this barograph or the thermograph that you are building?
A: Exactly. Take Negretti and Zambra, for example. In the 1800-1900s they made beautiful, classic scientific weather instruments. I believe we can create similar instruments like in the old days, but using precise, real-time data. We can attach the data to anything - a weather vane, barograph, bells, lights, etc. We’re not making things to replace a weather app - it’s more like connecting the data to an object that can respond to specific points of data.
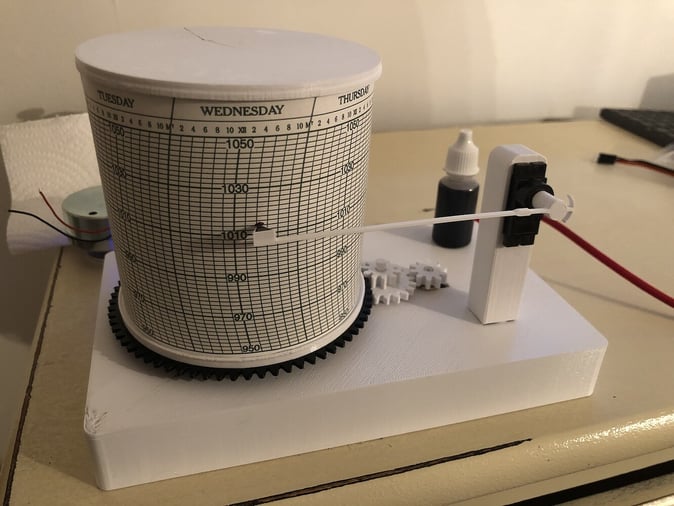
Currently, I get the data from a Tempest at the back of my greenhouse. We use free software (Wewx) on Raspberry Pi. Most things are Raspberry Pi-based, which allows us to take the Tempest data feed (lightning strike, wind, humidity, temperature, UV, solar brightness data) and integrate that with a physical thing. We are making a physical representation of the data and creating a new language around weather. This new physical device language ultimately aims to help people understand climate and climate change.
Q: This sounds next level.
A: It is, I guess. The Tempest station teaches students how to build things (Fusion 360/3D printing) as well as how to communicate and understand data. I think of it as the maker craft movement from geospatial to tangible. We display data using scientific instruments instead of a screen. The WeatherFlow API is perfect for this, and we link to MQTT and use it to drive all kinds of data visualizations.
Q: So how do you think this will help with your ultimate goal to help individuals understand and manage climate change in their life?
A: There is something nice about using the most modern technology, like the Tempest Weather System, but displaying the data in an analog way. There is something about the mixing of the worlds that’s intriguing. But I’m mostly trying to communicate complex science. We hope people worldwide will make their own things and maybe start a maker movement using their Tempest data feeds.
Interview by Ann Marie Gardner. Find her on Instagram. @thenewweather
Back to: Newsletter